Background
If all of the Earth’s available freshwater from the ground, lakes, swamps, and rivers were condensed to a single sphere, that sphere would be 270 km in diameter, which, if placed tangent to the Earth’s surface, would stand 270 km high and project a shadow that is the size of Croatia [28].
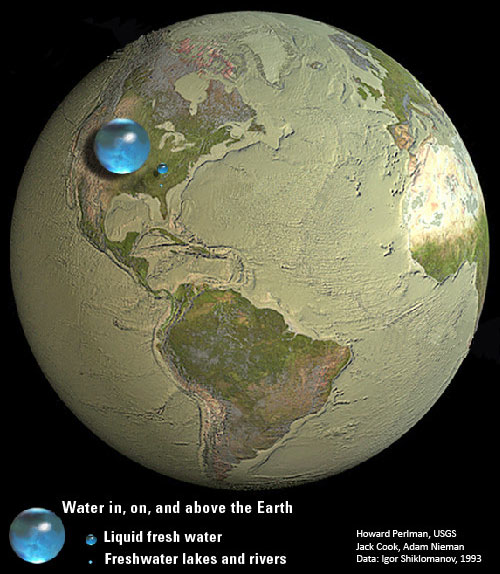
Figure 1: Relative amount of freshwater on the Earth [45]
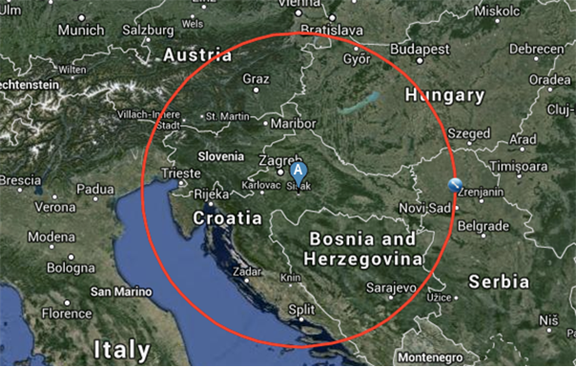
Figure 2: Sphere A is the total amount of available freshwater [46]
Of this sphere, 10 percent is used extracted for human water consumption [26], which narrows the sphere to a sphere that is 130 km in diameter, and would project onto Montenegro [28].
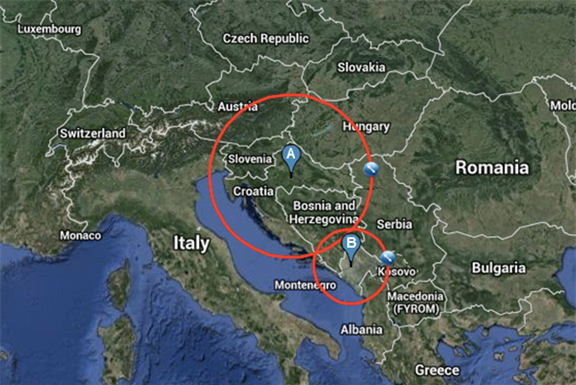
Figure 3: Sphere B is water extracted for human consumption [46]
As of today, the global annual water withdrawal sits at 3,800 km3/year, and this number will only increase exponentially [27]. The world must face the fact that Croatia can hold four land equivalents of Montenegro, and water availability has reached crisis standards (Figure 4).
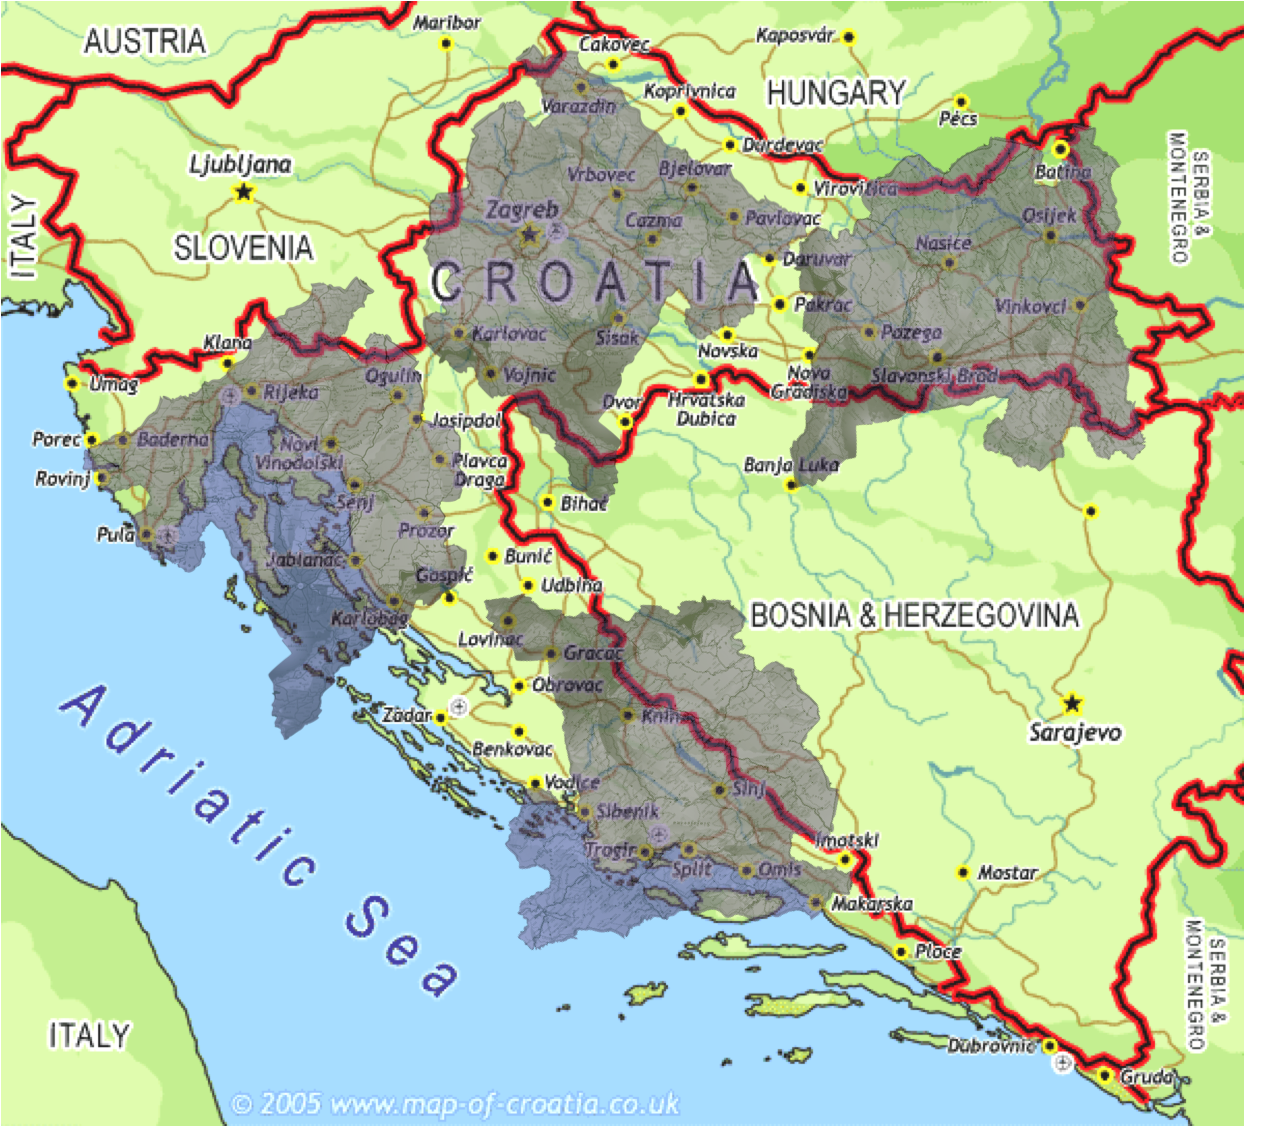
Figure 4: Mapping Montenegro (purple) over Croatia (yellow). Adapted from [29][30][31]
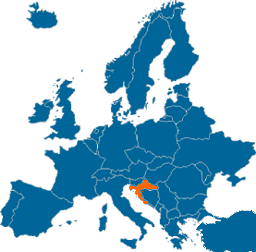
Figure 5: Map of Europe, Croatia Highlighted [32]
Agriculture uses 90 percent [31] of the water that is consumed globally, which is equivalent to a sphere 120 km in diameter, which projects a shadow the size of Qatar [28].
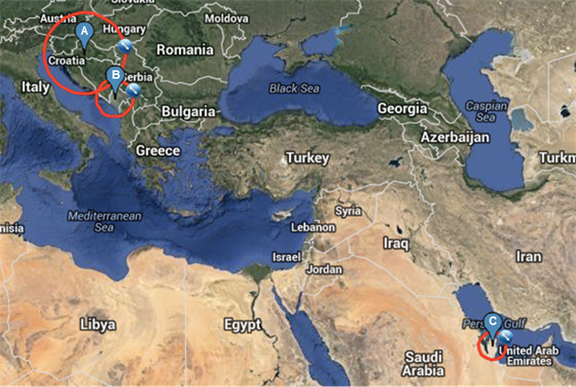
Figure 6: Sphere C is the amount of water consumed globally [46]
The majority of agricultural irrigation around the world is done essentially in the same manner, and one simple solution can save up to 30 percent of water used for agriculture, which equates to approximately 30 percent of the sphere covering Qatar [5]. Implementing a protective barrier within the agricultural water’s main line of transport can save a third of the water used for agriculture and instead, use the potable water conserved as drinking water for those who lack sufficient access to clean water.
Reality
Currently, there are 3.1 million km2 of land available for irrigation purposes, while only 2.6 million km2 are utilized [18].
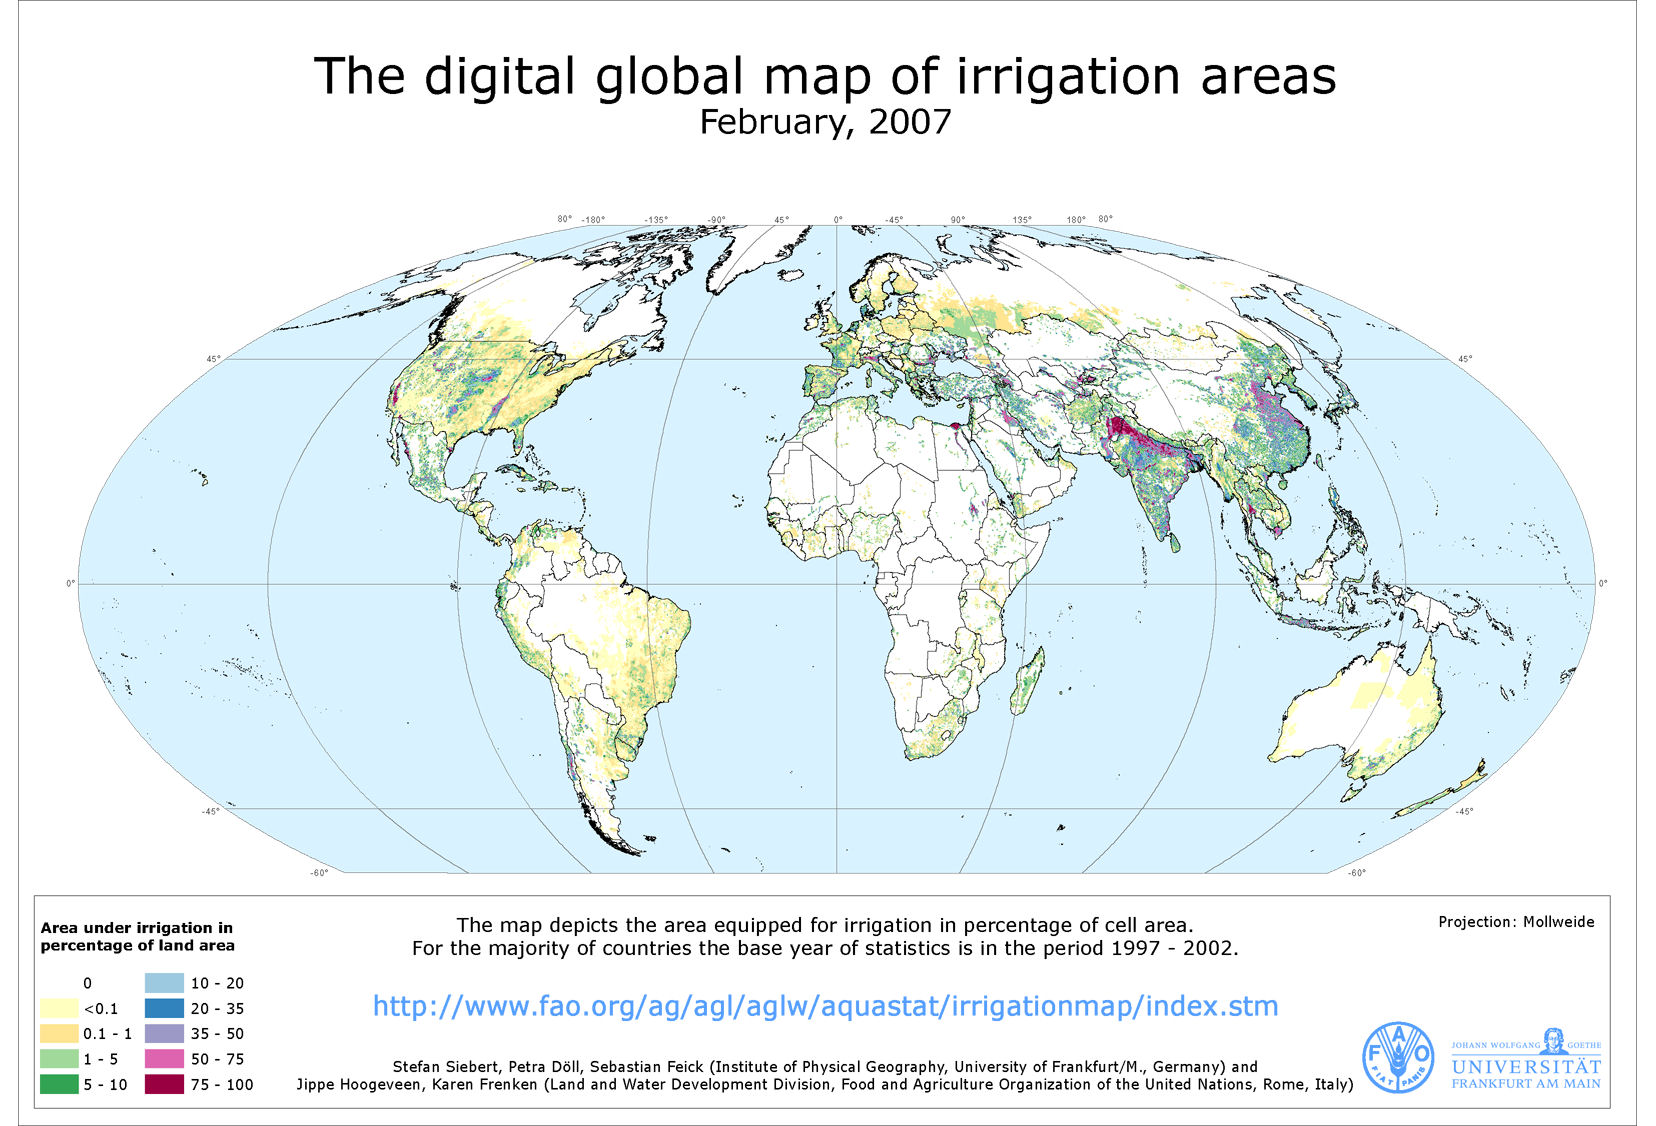
Figure 7: The digital global map of irrigated areas [51]
This is the reality of global farming: 95 percent of these irrigated lands use flood irrigation systems [17], the least water efficient, yet least expensive irrigation technique of combined surface and sprinkler irrigation techniques (see Figure 18 for all types).
Irrigation Systems Worldwide
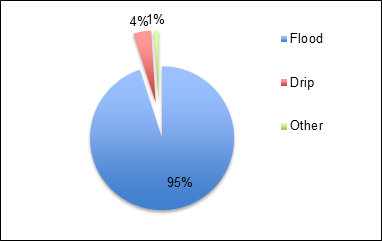
Figure 8: Comparison of irrigation types
Flood irrigation can be divided into three categories: basin, furrow, and border, all of which function very similarly.
1. Basin Irrigation
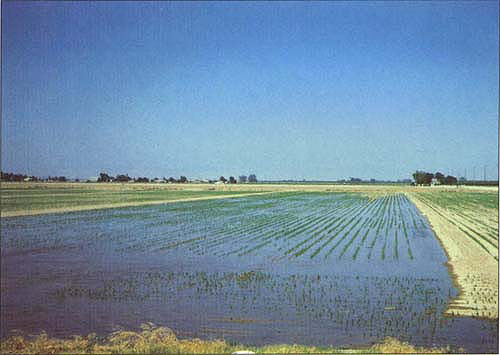
Figure 9: Water is typically applied to a leveled basin, which is enclosed by borders or ridges. The surface of the basin can be left flat or molded to ridges or beds, depending on farmer’s preference [7]. [6]
2. Furrow Irrigation
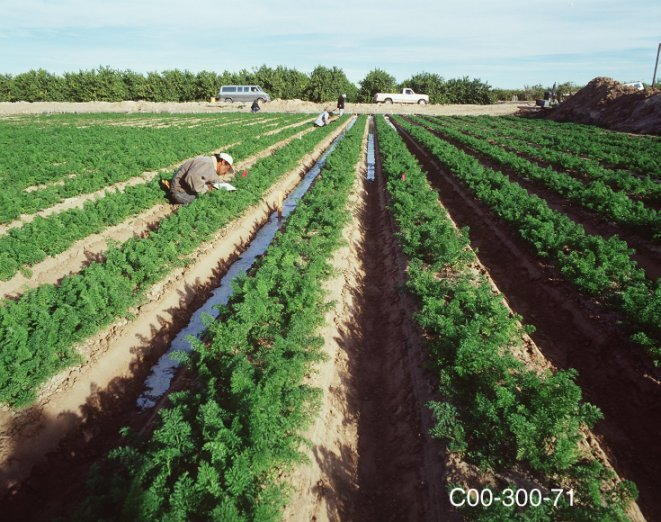
Figure 10: Water is poured into channels that are typically designated to run along the predominant slope of the field. Crops are planted on the peaks, while water runs along the troughs of the channels [7]. [8]
3. Border or Border Strip Irrigation
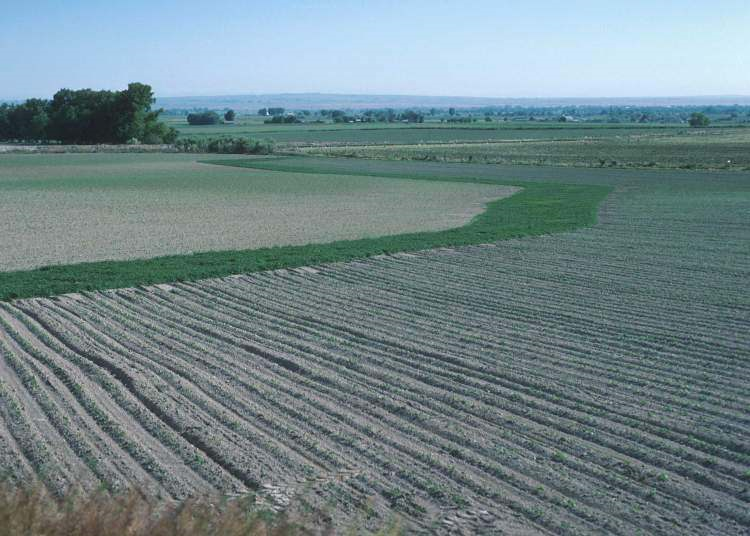
Figure 11: The land is divided into strips that run parallel to the predominant slope of the field, very similarly to furrow irrigation. Water is poured into the troughs in between the strips. With border irrigation, the strips of land are normally narrower and longer than those of furrow irrigation [7]. [9]
All of these methods are engineered in a way such that a main canal runs the length of the entire field, flush to the field, and perpendicular to the rows of crops. This main canal (highlighted in figure 12) is the major source for all of the water delivered to the field, and is the component of the system that is most prone to water loss due to factors such as evaporation and soil absorption [7]. Figure 12 below demonstrates the loss in application efficiency (see appendix) between the various soil types in flood-based irrigation while holding all other variables constant (climate, crop type, daylight exposure, etc.).
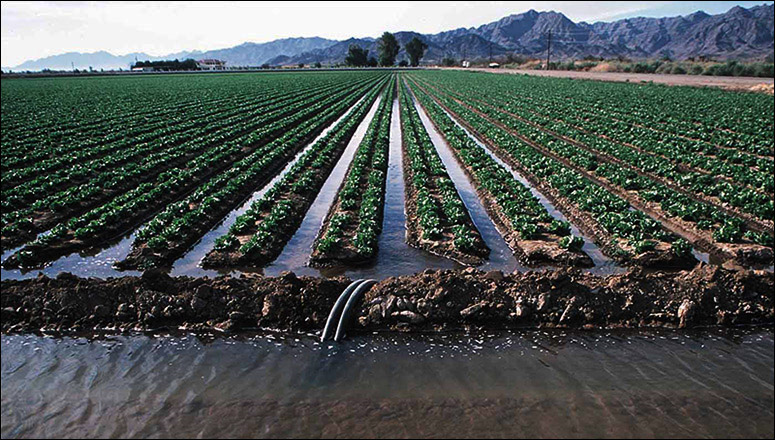
Figure 12: Typical structure of surface irrigation [22]
Canal Application Efficiencies with Various Soil Types [A]
|
Earthen canals |
Lined canals |
|||
| Soil type |
Sand |
Loam |
Clay |
|
| Canal length | ||||
| Long (> 2000m) |
60% |
70% |
80% |
95% |
| Medium (200-2000m) |
70% |
75% |
85% |
95% |
| Short (< 200m) |
80% |
85% |
90% |
95% |
Figure 13: Comparing efficiency rates among canals on different soil types [23]
The column in Figure 9 labeled ‘Lined canals’ illustrates the improved efficiency if the main canal were lined with a material less porous than earthen soil, such as concrete, brick, or plastic [23]. These simple canals can save, at a minimum, 5 percent of the total water used to irrigate a field that uses earthen canals. On average, this technique can save roughly 20 percent of the total water used to irrigate the same field.
Perspective
Putting this into perspective, saving 20 percent of the water used globally for flood irrigation would save 181,500 km3 of water, or 1.815 x 10¹⁷ L of water (roughly 2 quintillion liters), which is enough for every individual on the planet to drink 25,200,000 L of water at any moment, even given the global population of 7.2 billion. The 20 percent saved would encompass a sphere of water of diameter 70 km wide, and project a shadow the size of the Cape Verde islands if the islands were combined into one island.
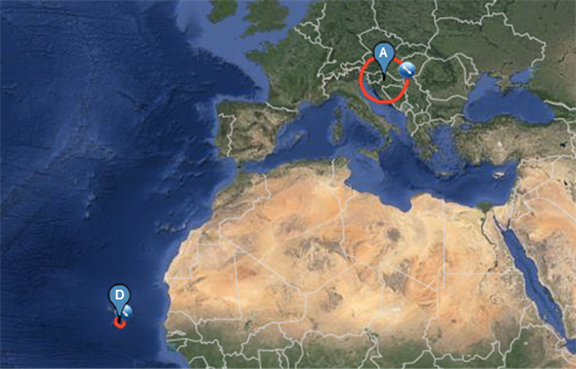
Figure 14: Sphere D is the amount of water saved. Sphere A is for reference [46]
Current improvements that irrigators have taken in the past are the following:
1. Leveling of the fields – removing any irregularities above or below the level line of the irrigation field to reduce the amount of crops that receive too much or too little water due to irregular elevation
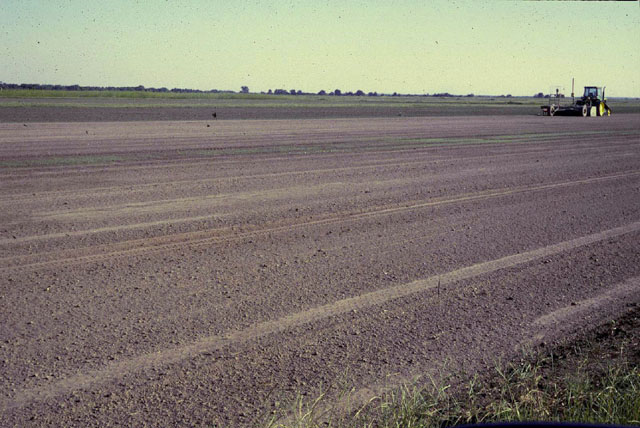
Figure 15: Level field [19]
2. Surge flooding – releasing water over designated time intervals to reduce runoff
3. Capturing and reusing runoff – capturing the runoff water to reuse for next cycle of irrigation
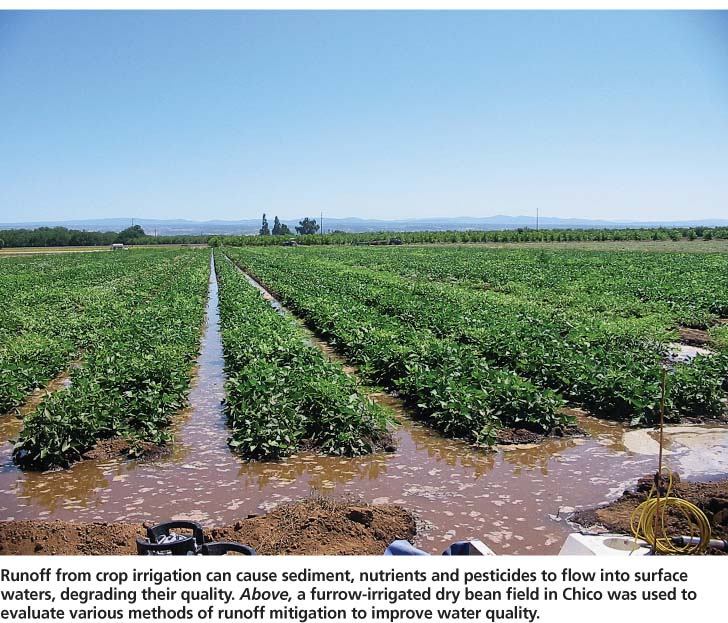
Figure 16: Extra water runs out of canals as runoff [20]. [21]
Why Other Solutions Don’t Work
There are many alternative irrigation techniques that have much higher application efficiencies, as shown in Figure 17 below. The categories are also defined below.
Types of Irrigation Methods and Efficiencies
| Irrigation methods | Field application efficiency |
| Surface irrigation (border, furrow, basin) |
60% |
| Sprinkler irrigation |
75% |
| Drip irrigation |
90% |
Figure 17: Compares different efficiency rates among different types of irrigation [23].
Irrigation Types Hierarchy
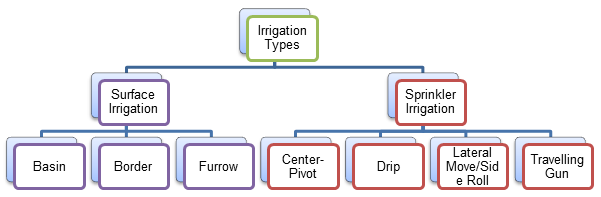
Figure 18: Illustrated more clearly the different types of irrigation [7]
Drip and irrigation techniques are much more efficient than flooding (also known as surface) irrigation methods because water enclosed in the pipes of sprinkler systems is much less prone to evaporation.
The irrigation system that is often said to be most water efficient, reaching efficiencies of up to 95 percent [3], is drip irrigation, only covers 103,000 km2 of land globally [16]. Out of the 2.6 km2 million of lands that are growing food, less than 4 percent uses drip irrigation as its primary water distribution method.
There is a reason for this: sprinklers and drip systems of irrigation are more costly than surface irrigation. Simple implementation, or capital cost, is orders of magnitude greater for sprinklers and drip than that of lining a canal.
Costs for Implementing Various Irrigation Systems
| Irrigation Method | Capital Cost per km2 | |
| Center Pivot |
$26.31 |
|
| Side Roll |
$31.88 |
|
| Drip |
$47.94+ |
|
| Travelling Gun |
$31.63 |
|
| Canal Lining |
$9.44 |
EPDM |
|
$15.88 |
Urethane | |
|
$25.89 |
Concrete |
Figure 19: Compares different costs of implementing different irrigation techniques [35][36][37][38][39][40][41][42][43]
Ethylene-Propylene-Diene Monomer, or EPDM and urethane are the main types of plastics used to line canals [37]. Concrete is more expensive, but very durable, lasting up to 80 years [50].
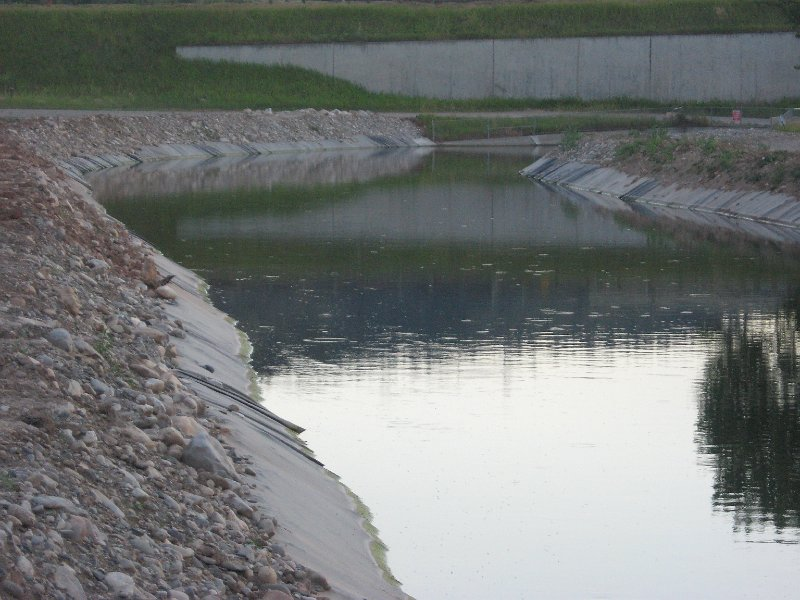
Figure 20: EPDM liner in a canal [49]
Even though it appears that canal liners are quite close in price to other methods of irrigation, the lining only covers the surface area of the canal, whereas the sprinkler systems cover entire crop fields. Any canal lining per km2 covers much larger areas of total crop field than the other methods in this comparison.
A Viable Solution?
Lining canals has been implemented in many areas, including the Deschutes River Basin in Central Oregon, United States. The Deschutes River had been diverted for many years to serve families and agricultural needs, and the region has seen a water shortage. The earthen canals used for irrigation were actually comprised of very porous, volcanic soil, and the area saw application efficiencies as low as 50 percent. The Deschutes region has implemented many lined canals on their farms, which, with similar project efforts, which have restored 1.5 cubic meters per second of streamflow in the area, or 1,500 additional liters of water in the river at any given time [24].
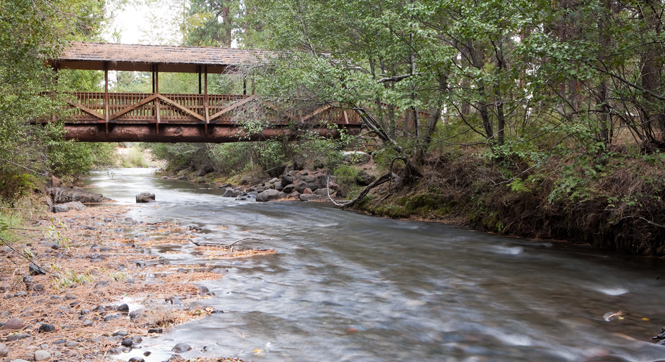
Figure 21: Restored branch of Deschutes River, Whychus Creek [25]
Implementation
While the spread of complete implementation is a long-term solution that is expected to span 30 years, the effects of one canal on the surrounding rural community will be felt immediately after implementation.
Mission 2017 plans to work with the Massachusetts Institute of Technology chapter of Engineers Without Borders (EWB), a non-profit organization that is student run. In the words of the MIT chapter, “We are introducing a new approach to international development at MIT. Rather than focusing on developing new technologies, EWB focuses on building a capacity building relationship with a community. A typical relationship with a community can be 4-5 years, at the end of which it is hoped that a community can be self-sustaining, and can continue their development on their own.” [44]. Mission 2017 plans to follow similar steps by interacting with the local communities to foster a relationship that is essentially self-managed by the respective community. EWB sends teams of students to many areas around the world to guide projects that vary from clean and potable water access to electricity access.
By sending a team from EWB, Mission 2017 will use an initial rural village in South Africa as the first attempt to implement the canal system. Approximately 65 percent of South Africa does not receive enough rain for a self-sufficient irrigation system, and 15,000 km2 of land are available for irrigation [47]. The team will speak with village officials, and ask permission to hold an informational meeting to simply discuss the impacts of implementing other irrigation systems. If the village agrees to the initial plans of canal lining, a committee headed by village leader figures will be designed to move forward with construction of the liners. The EWB team will help and advise the committee, but the village leaders will make all of the final decisions. Once decided upon, actual building of the canal lining takes very little time; a team of 8 manual laborers can line anywhere from 150 to 300 meters of canals in one day [37].
Once this project proves successful, the MIT sector of EWB will spread the idea to the United States’ national Engineers Without Borders (EWB-USA) organization, who’s goals are the same as the MIT branch’s goals: “to support community-driven development programs worldwide through partnerships that design and implement sustainable engineering projects.” [48] EWB-USA will implement these projects worldwide.
Notes
[A] Application efficiency, abbreviated Ea, is a standard measurement defined as the following formula,
Ea = 100(Vs/Vf)
Ea stands for application efficiency, Vf is the amount of water delivered to the field or farm, and Vs is the amount of water stored in the root zone from the irrigation application. Vs and Vf are measured in m3 [4].
Sprinkler System
1. Center Pivot
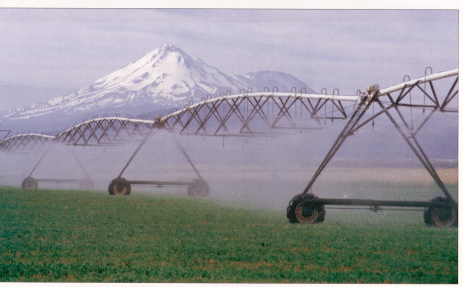
Water is delivered from overhead sprinkler nozzles attached to an automated rotating pivot point, encircling a large circular patch of land [10][12].
2. Drip Irrigation
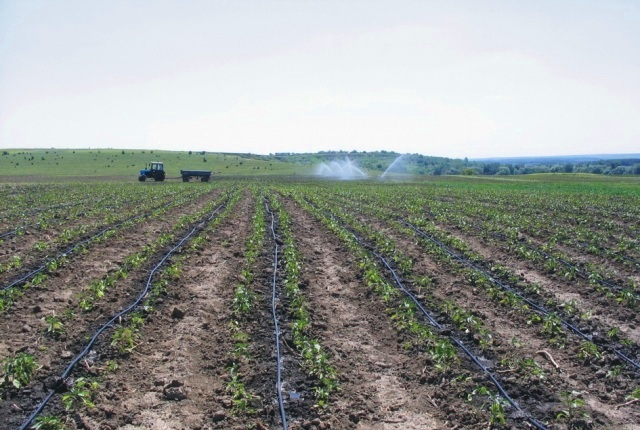
Water is applied adjacent to the roots of the plant via an application tube, which can contain orifices, emitters, pores, or perforations for water to escape through. The tubing can run above ground or under ground [11][12].
3. Side Roll
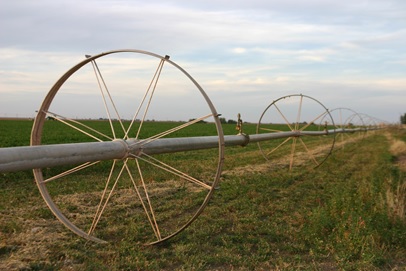
The tubing that forms the axle of the wheels is the water delivery mechanism, spraying water towards the crops below. The wheels are electricity powered to roll about the axle, moving the entire pipe laterally across the field [7][13].
4. Travelling Gun
Water is projected out over the tops of crops by the force of a mechanized gun that moves parallel to the crop rows [12][14].
References
1. Forsythe, G. (2006). A Critical History of Early Rome: From Prehistory to the First Punic War. University of California Press.
2 .”Human Appropriation of the World’s Fresh Water Supply.” Human Appropriation of the World’s Fresh Water Supply. University of Michigan, n.d. Web. 30 Nov. 2013. http://www.globalchange.umich.edu/globalchange2/current/lectures/freshwater_supply/freshwater.html
3. Howell, Terry, A. “Irrigation Efficiency.” United States Department of Agriculture. N.p., n.d. Web. 24 Nov. 2013. http://www.cprl.ars.usda.gov/pdfs/Howell-Irrig%20Efficiency-Ency%20Water%20Sci.pdf
4. AgriMet. (n.d.). Irrigation Guide. Retrieved December 3, 2013, from http://www.usbr.gov/pn/agrimet/irrigation.html
5. “Annex I: Irrigation efficiencies.” Annex I: Irrigation efficiencies. Food and Agriculture Organization, n.d. Web. 26 Nov. 2013. http://www.fao.org/docrep/t7202e/t7202e08.htm
6. Grismer, Mark E. Irrigated Field. 2013. California Agriculture, California. University of California. Web. 26 Nov. 2013.
7. Solomon, Kenneth. “Welcome to Wateright.” Welcome to Wateright. California State University, n.d. Web. 3 Dec. 2013. http://cwi.csufresno.edu/wateright/880105.asp
8. Regional Photo Lab. Irrigated Crops. N.d. Managing Water in the West, Colorado. US Department of the Interior: Bureau of Reclamation. Web. 26 Nov. 2013.
9. Blake, Ron. Filter Strip. N.d. Natural Resources Conservation, United States. United States Department of Agriculture. Web. 26 Nov. 2013.
10. Campbell, W. J. (n.d.). Remote Sensing Tutorial Page 3-3. Remote Sensing Tutorial Page 3-3. Retrieved November 25, 2013, from https://www.fas.org/irp/imint/docs/rst/Sect3/Sect3_3.html
11. Q&A Interview: Poverty Reduction and Protecting the Environment. (n.d.). Millennium Challenge Corporation. Retrieved December 1, 2013, from http://www.mcc.gov/pages/povertyreductionblog/entry/qa-interview-poverty-reduction-and-protecting-hte-environment
12. Perlman, H. (n.d.). Some irrigation methods. Irrigation: How farmers irrigate fields. Retrieved November 25, 2013, from http://ga.water.usgs.gov/edu/irquicklook.html
13. Texas A&M University. Side Roll Irrigation. N.d. Ogallala Aquifer, Texas, United States. United States Department of Agriculture. Web. 25 Nov. 2013.
14. Augustin, Chris. A traveling gun applies effluent on a corn field. N.d. Reduce Containment Pond Levels in Wet Years, North Dakota, United States. North Dakota State University. Web. 23 Nov. 2013.
15. “Irrigation techniques.” Irrigation: , USGS Water-Science School. US Geological Survey, n.d. Web. 2 Dec. 2013. http://ga.water.usgs.gov/edu/irmethods.html
16. Drip Irrigation Expanding Worldwide. (n.d.). News Watch. Retrieved December 1, 2013, from http://newswatch.nationalgeographic.com/2012/06/25/drip-irrigation-expanding-worldwide/
17. Smathers, R. L. (1995). Economics of surface irrigation systems /. Moscow, Idaho : University of Idaho Cooperative Extension System,.
18. Renner, J. (n.d.). Global Irrigated Area at Record Levels, But Expansion Slowing.Worldwatch Institute. Retrieved November 4, 2013, from http://www.worldwatch.org/global-irrigated-area-record-levels-expansion-slowing-0
19. USDA. Level Field. N.d. Irrigation, United States. United States Department of Agriculture. Web. 3 Nov. 2013.
20. Grismer, Mark E. Runoff from crop irrigation. N.d. California Agriculture, California. University of California. Web. 3 Nov. 2013.
21. Agriculture. (n.d.). State Water Resources Control Board. Retrieved December 2, 2013, from http://www.swrcb.ca.gov/water_issues/programs/agriculture/
22. Going through withdrawals: Why less could soon be more for California farmers. (n.d.). Circle of Blue WaterNews. Retrieved December 1, 2013, from http://www.circleofblue.org/waternews/2008/world/north-america/going-through-withdrawals-why-less-could-soon-be-more-for-farmers-in-california/
23. CHAPTER 5 – IRRIGATION SYSTEM. (n.d.). CHAPTER 5 – IRRIGATION SYSTEM. Retrieved December 1, 2013, from http://www.fao.org/docrep/r4082e/r4082e06.htm
24. Water Conservation Program:Permanent Streamflow Protection. (n.d.). Water Conservation. Retrieved November 16, 2013, from http://www.deschutesriver.org/what-we-do/streamflow-restoration-programs/water-conservation/
25. McCaulou, Scott. Whychus Creek. N.d. Recovery Act funding helps to restore Deschutes River and Whychus Creek, Oregon, United States. Deschutes River Conservancy. Web. 21 Nov. 2013.
26. Oki, T. K. (2006, August 25). Global hydrological cycles and world water resources. Science, 313, 1068 – 1070.
27. Vital Water Graphics. (n.d.). Water withdrawal and consumption: the big gap -. Retrieved December 1, 2013, from http://www.unep.org/dewa/vitalwater/article42.html
28. World Bank: Data. (n.d.). The World Bank. Retrieved November 24, 2013, from http://data.worldbank.org/indicator/AG.LND.TOTL.K2?order=wbapi_data_value_2011+wbapi_data_value+wbapi_data_value-last&sort=asc
29. MONTENEGRO MAPS. (n.d.). Montenegro Maps || Visit-Montenegro.com. Retrieved December 3, 2013, from http://www.visit-montenegro.com/where.htm
30. Map of Croatia. (n.d.). Map. Retrieved December 3, 2013, from http://www.map-of-croatia.co.uk
31. WWAP | The 2nd UN World Water Development Report. (n.d.). WWAP | The 2nd UN World Water Development Report. Retrieved November 1, 2013, from http://www.unesco.org/bpi/wwap/press/
32. Not Just a Croatia Map!. (n.d.). Handy Croatia Map, Croatia Flag, Regions and info on the Geography of Croatia. Retrieved December 3, 2013, from http://www.love-croatia.com/Croatia-Map.html
34. Geography of Cape Verde. (n.d.). HowStuffWorks. Retrieved November 13, 2013, from http://geography.howstuffworks.com/africa/geography-of-cape-verde.htm
35. Smout, I., & Shaw, R. (n.d.). Small-scale irrigation design. WEDC. Retrieved November 14, 2013, from http://www.lboro.ac.uk/well/resources/technical-briefs/42-small-scale-irrigation-design.pdf
36. Linear Move Sprinkler Irrigation Systems. (n.d.). Farm Water Delivery Systems. Retrieved November 13, 2013, from http://www.twdb.state.tx.us/conservation/BMPs/Ag/doc/5.3.pdf
37. Lining of District Irrigation Canals. (n.d.). Farm Water Delivery Systems. Retrieved November 13, 2013, from http://www.twdb.state.tx.us/conservation/BMPs/Ag/doc/6.1.pdf
38. Water District Delivery Systems. (n.d.). BMP Guide. Retrieved November 13, 2013, from http://www.savetexaswater.org/bmp/doc/Agriculture/Lining_of_Canals.pdf
39. 60 Acre Pivot Irrigation Cost Analysis. (n.d.). Timely Information: Agriculture, Natural Resources & Forestry. Retrieved November 14, 2013, from http://www.aces.edu/timelyinfo/BioSysEng/2008/October/BSEN-IRR-08-01.pdf
40. Scherer, T. (n.d.). Selecting a Sprinkler Irrigation System. North Dakota State University. Retrieved November 23, 2013, from http://www.ag.ndsu.edu/pubs/ageng/irrigate/ae91.pdf
41. Drip Irrigation. (n.d.). Irrigated Farming Systems. Retrieved November 12, 2013, from http://moreprofitperdrop.files.wordpress.com/2011/11/drip-irrigation.pdf
42. Netafim Drip/Micro Irrigation Solutions. (n.d.). Landscape. Retrieved December 3, 2013, from http://www.netafimusa.com/landscape/drip-irrigation-guide-5
43. Canal-lining demonstration project . (n.d.). US Department of the Interior: Bureau of Reclamation. Retrieved November 24, 2013, from http://www.usbr.gov/pn/programs/wat/publications/canallining.pdf
44. Engineers Without Borders – Massachusetts Institute of Technology. (n.d.). EWB-MIT | Engineers Without Borders | Massachusetts Institute of Technology. Retrieved December 3, 2013, from http://ewb.mit.edu/about.php
45. Drip Irrigation . (n.d.). Drip Irrigation. Retrieved December 3, 2013, from http://www.friscotexas.gov/departments/publicworks/water/lawnGarden/Pages/DripIrrigation.aspx
46. Free Map Tools. (n.d.). Radius Around a Point on a Map. Retrieved December 1, 2013, from http://www.freemaptools.com/radius-around-point.htm
47. South Africa. (n.d.). AQUASTAT. Retrieved November 4, 2013, from http://www.fao.org/nr/water/aquastat/countries_regions/south_africa/index.stm
48. About Us. (n.d.). – Engineers Without Borders. Retrieved December 2, 2013, from http://www.ewb-usa.org/our-story/about-us
49. Martin Excavating LLC. (n.d.). Martin Excavating LLC. Retrieved December 3, 2013, from http://www.martinexcavating.net/177/pages/gallery/home.html
50. Water Operation and Maintenance Bulletin. (n.d.). Managing Water in the West. Retrieved November 25, 2013, from http://www.usbr.gov/assetmanagement/WaterBulletins/228-March%202012_WEB-FULL.pdf
51. Siebert, S. (Designer). (2013, October ). The digital global map of irrigation areas [Print Photo]. Retrieved from http://www.fao.org/nr/water/aquastat/irrigationmap/gmia_v5_lowres.pdf
