This page shows some important data that we used as the basis for many solutions. It shows the current demographics, causes and locations of hunger, as well as various population predictions for the future. The first chart below summarizes some of the current knowledge about hunger in the world, while the second identifies the most vulnerable demographic groups.
Current Demographics, Causes and Locations of Hunger
|
Food-insecure classes |
Principal causes of hunger/malnutrition | Percentage of undernourished | Geographic "hotspots" of hunger |
| Low-income farm households | Increased production pressure on low-productivity, high-risk or degraded lands; remoteness from markets; poor market institutions | 50% of total (400 million) | Dry lands: Sahel, southern Africa, South Asia, NE Brazil; mountains: Mesoamerica, Andes, E Africa, Himalayas, SE Asia |
| Rural landless and low income non-farm households | Inadequate income; weak social networks; lack of access to productive resources; lack of employment | 22% of total (176 million) | Asia, Central America |
| Low-income urban households | Inadequate income to purchase food; weak social networks, low productivity, wages | 20% of total (160 million) | China, India, Zambia |
| Poor herders, fishers, forest people dependent on community or public resources | Pressure on natural resources; pollution; disruption of resource flows; loss of local rights | 8% of total (64 million) | Dry lands: Africa, lowland Asia; forest regions or Amazonia, Himalayas, SE Asia |
Source: Shaw, 2007
| Food-insecure classes | Principal causes of hunger/malnutrition | Percentage of undernourished | Geographic "hotspots" of hunger |
| Pregnant and lactating women | Added dietary needs for pregnancy and breastfeeding, inadequate food and micro-nutrient intake | Several hundred million | South Central Asia, SE Asia |
| Newborn infants | Inadequate foetal nutrition due to maternal malnutrition | 30 million | South Central Asia, SE Asia |
| Children under five years | Inadequate child care, poor feeding practices, infectious disease, poor water, low status of women | 150 million | South Central Asia, SE Asia, East Africa, West Africa |
| Micro-nutrient deficient individuals | Teenage girls and women (iron); nutrient-deficient diets/soils; lack of sunlight; lack of protein, fruit, vegetables | 2 billion | Widely distributed |
| Victims of extreme events (natural disasters, war and civil conflict) | Disruption of food systems, loss of assets; aid not delivered, low farm investment | 60 million | Recent victims in Sahel, Horn of Africa, Southern Africa |
| HIV/AIDS and other adult disabilities | Inability to produce or access food; increased dependency ratio; depleted social networks | 36 million infected | Sub-Saharan Africa, but moving to Asia |
Source: Shaw, 2007
Demographic Predictions
Population Predictions to 2050 and 2100
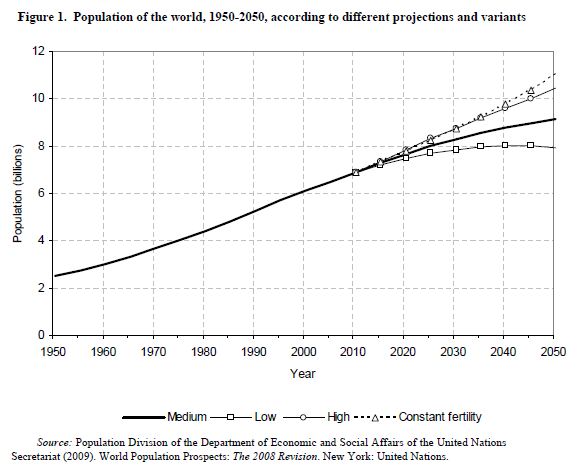
The United Nations makes yearly predictions of global population trends; the most recent of these formed the basis of our project. According the United Nations, the population reached 6.8 billion sometime during 2009. Overall, the current trends reveal that the global population is increasing, but the rate of increase is slower than it was during past decades. Various projections to 2050 show that the population could be anywhere between 7.4 billion (low fertility model) and 10 billion (high fertility model). Attempts made to predict the population in 2100 are even more variable.
For the purposes of this project, we relied on the medium-fertility predictions shown in the figure below. These show a population in 2050 of approximately 9.1 billion people. That is a 33% increase over today’s population. The medium-fertility models further predict that the population will peak at around 10 billion in 2075 and either hold steady or slowly decline until the end of the century. This is mainly a result of today’s developing countries eventually going through a demographic transition and becoming more developed. As the developing world goes through this transition, the countries with typically high birth rates and death rates will see their birth rates and death rates drop, and their populations will stabilize.
The UN predictions also give interesting information about the distribution of people between cities and rural areas in the future. For the last several thousand years, the number of people living in cities as opposed to rural areas has slowly increased. In 2009, for the first time in history, 50% of the human population lived in urban areas, and the increasing urban trend is likely to continue. By 2020, the world’s rural population is expected to start to decline, and will probably continue declining for the rest of the century.
The global urban population, on the other hand, will probably increase dramatically. In 2050, 6.3 billion people will live in cities, or 69% of the world’s projected population. That means that nearly the equivalent of the world’s current population will be living in urban areas in 40 years. Most of the growth in cities will take place in developing countries, especially in Asia and Africa. The urban population of Africa is likely to triple before 2050, and the urban population of Asia will double. The projections which provided the foundation for our project show that countries like China, India, Nigeria, Bangladesh, Indonesia, and Pakistan are projected to see their cities’ populations grow remarkably quickly in the next half-century.
United Nations Department of Economic and Social Affairs.(2009). World Urbanization Prospects: The 2009 Revision. Retrieved 5 November 2010, from http://esa.un.org/unpd/wup/index.htm
United Nations Department of Economic and Social Affairs. (2008). World Population Prospects: The 2008 Revision. Retrieved 5 November 2010, from http://www.un.org/esa/population/publications/wpp2008/wpp2008_highlights.pdf
Shaw, D. J. (2007). World food security: a history since 1945. New York: Palgrave Macmillan.